Urban Heat Island Analysis
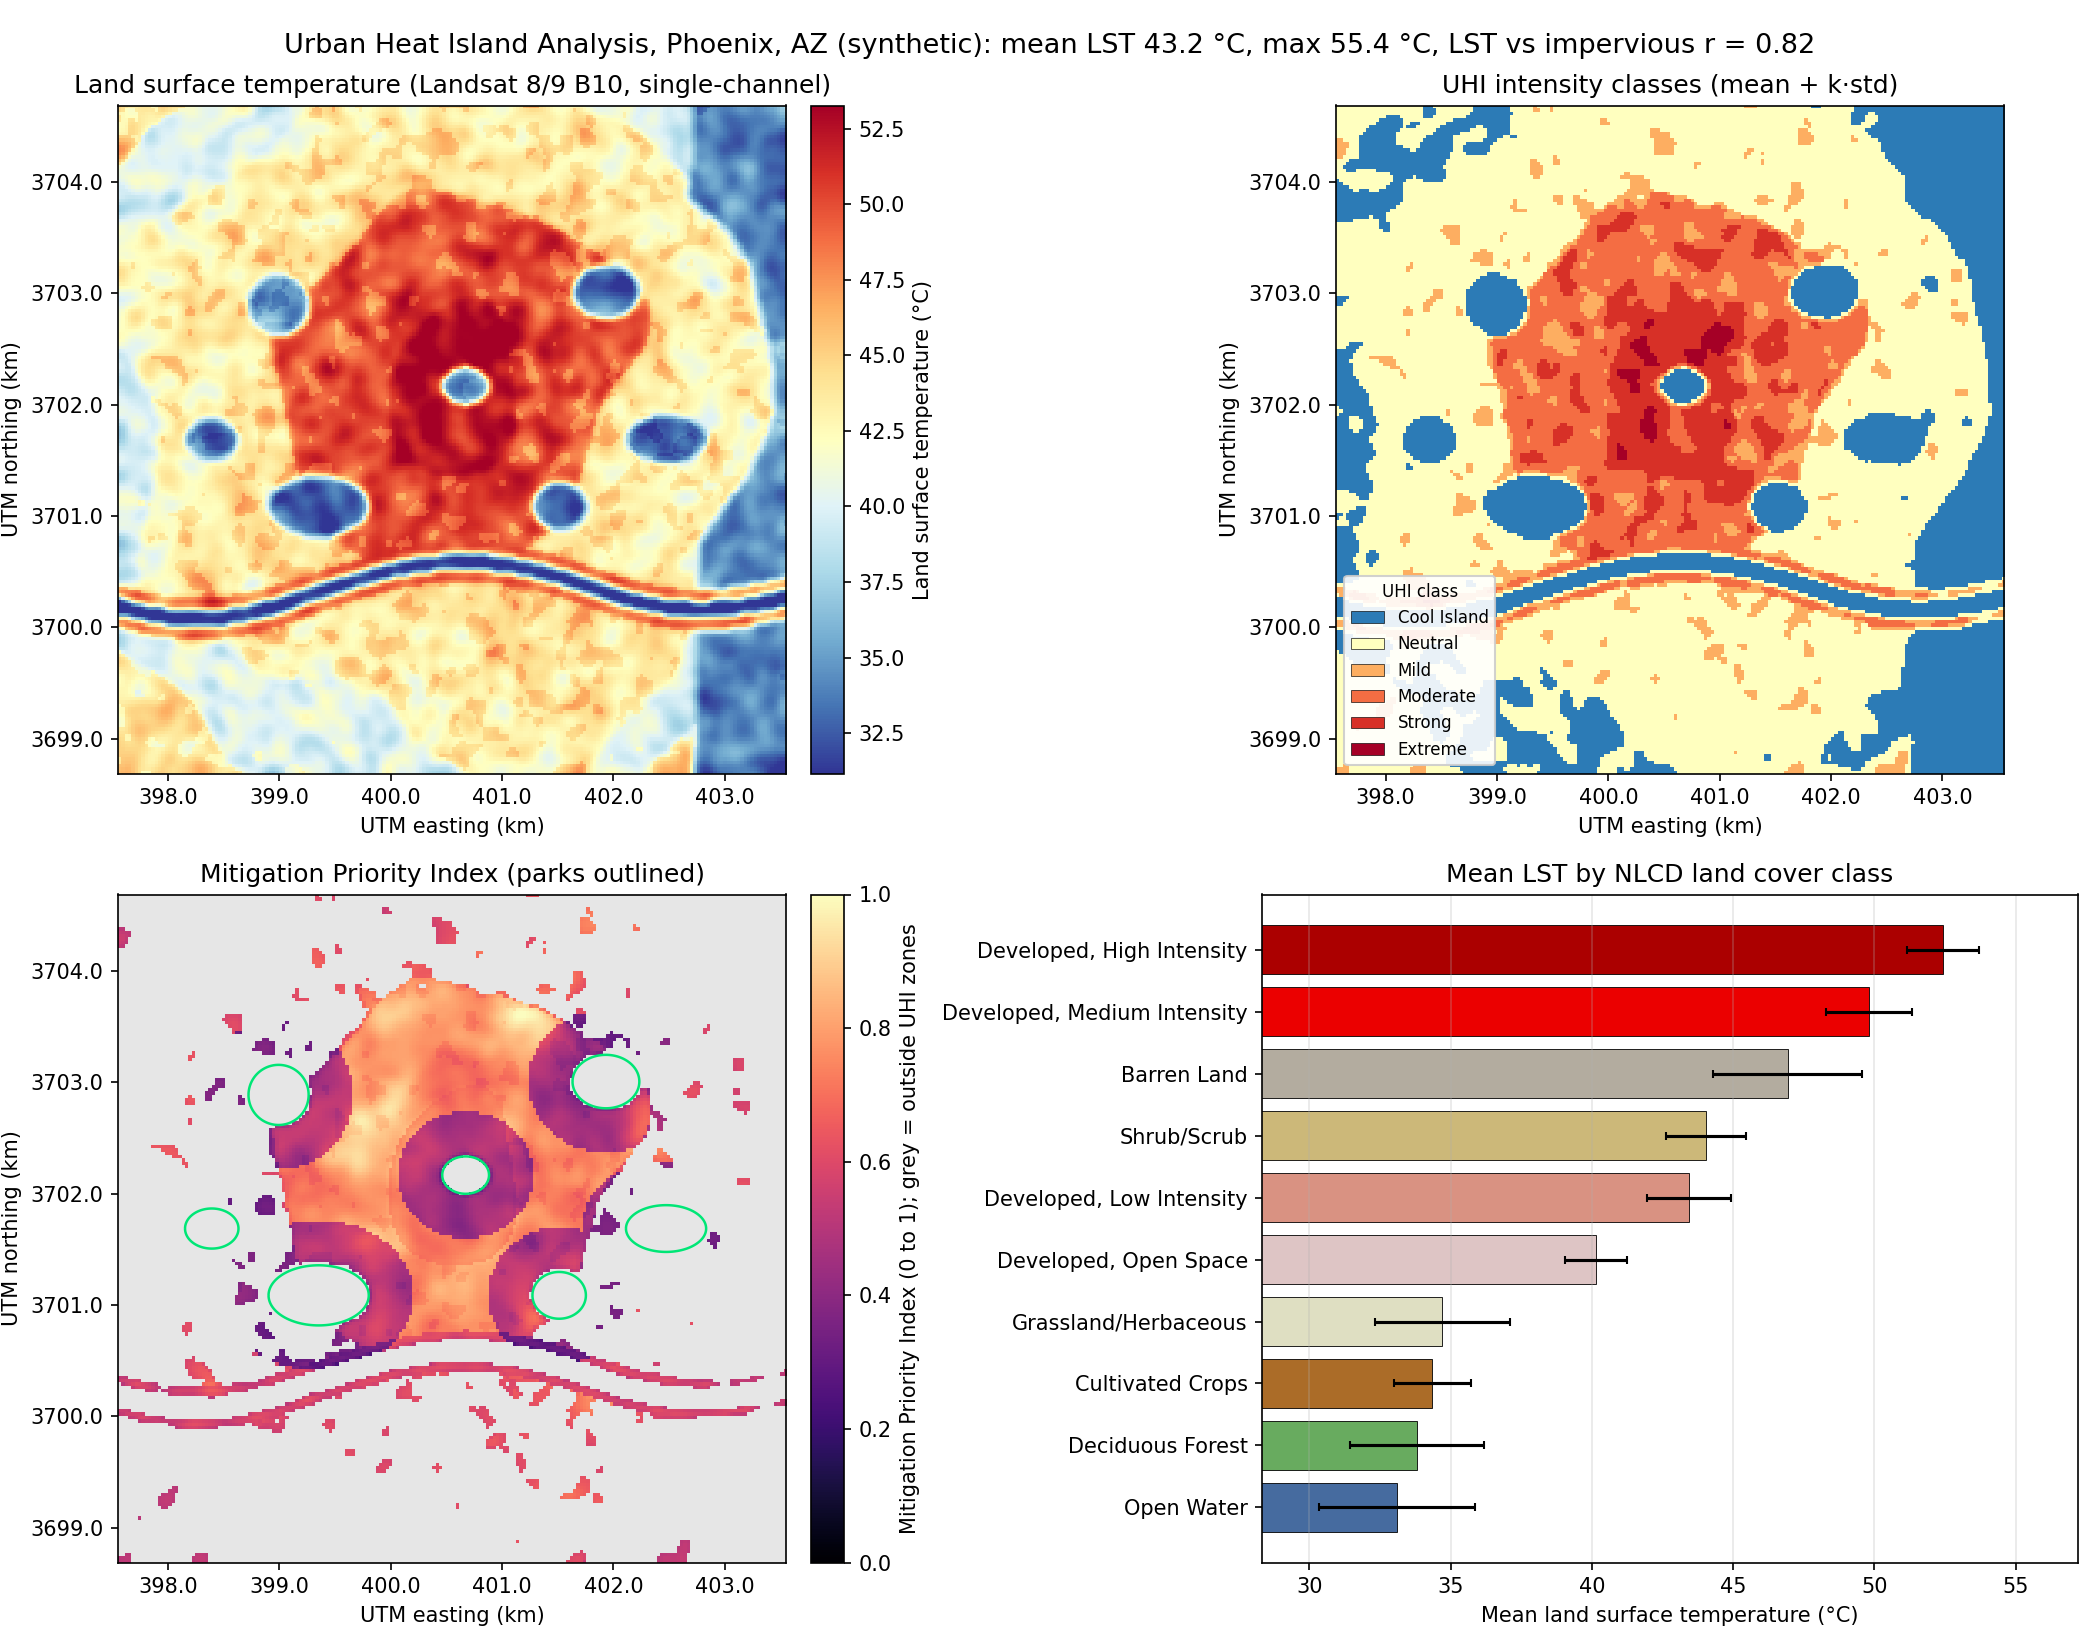
Landsat 8/9 thermal band to land surface temperature, UHI intensity classes, land-cover correlation and a Mitigation Priority Index that tells planners where trees and cool roofs help most.
Geospatial analysis portfolio: six end-to-end projects built with QGIS and Python. Each one runs on one command, ships an interactive web map and a Streamlit dashboard, and includes QGIS styles and a Processing Toolbox script.
Click a title for the full write-up (method, formulas, real data sources). The interactive maps open directly in the browser. Numbers shown are the actual output of each project's demo run (synthetic scene, seed 42).
Landsat 8/9 thermal band to land surface temperature, UHI intensity classes, land-cover correlation and a Mitigation Priority Index that tells planners where trees and cool roofs help most.
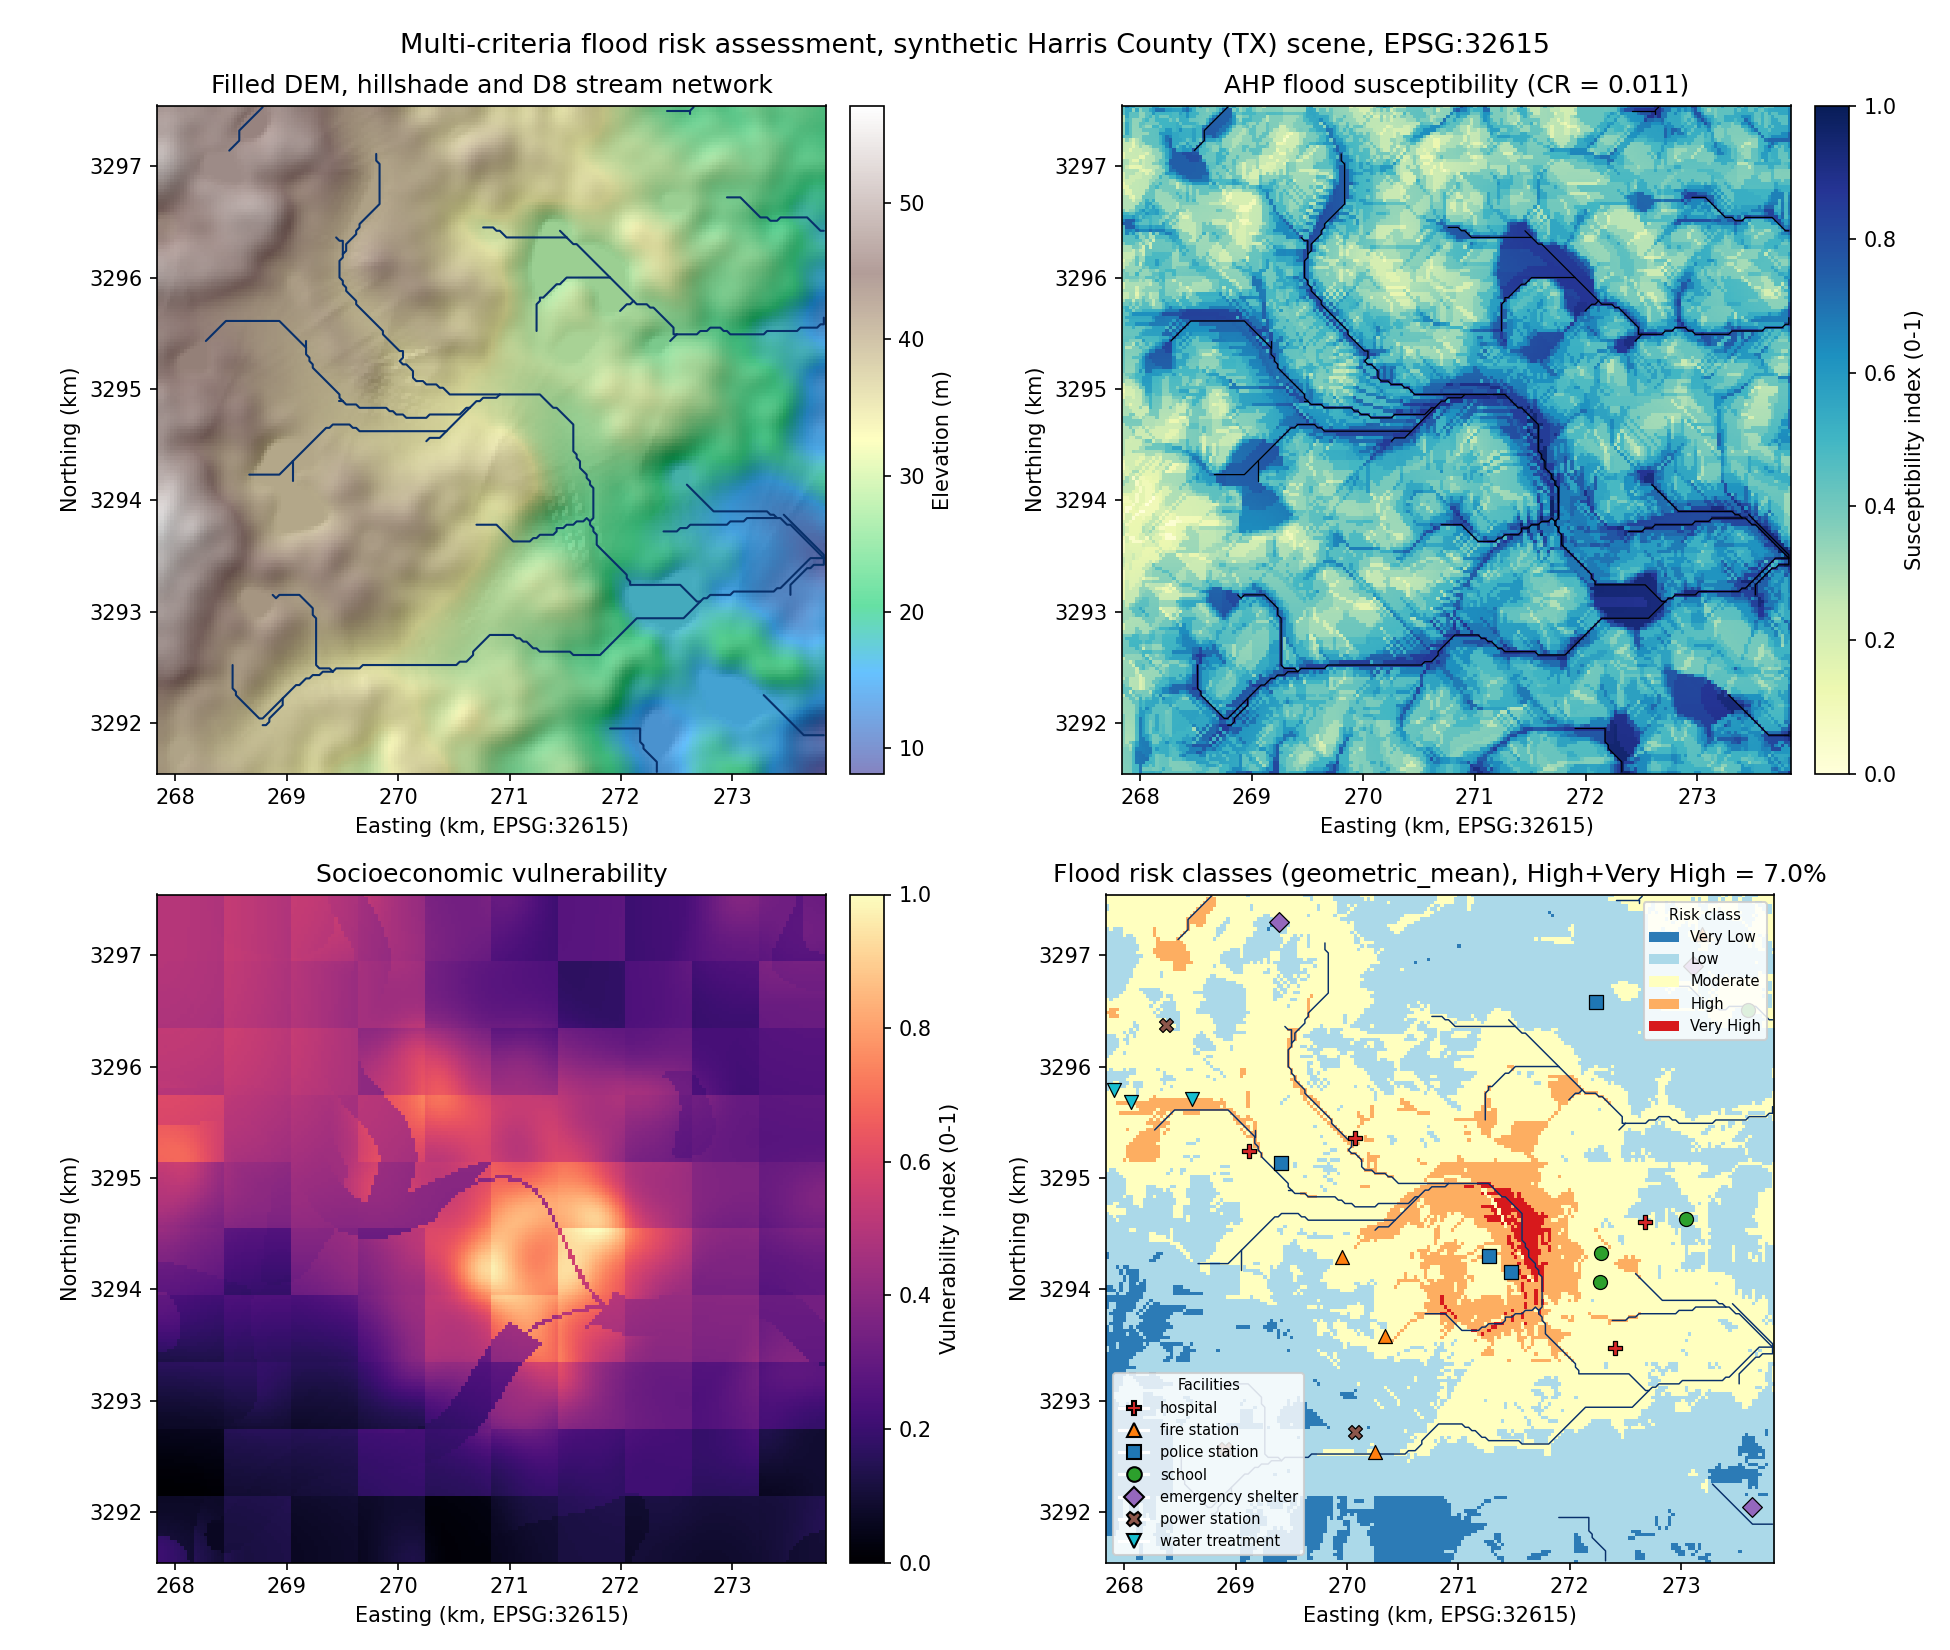
Priority-flood DEM conditioning, D8 flow and TWI, a seven-criteria AHP hazard model, socio-economic vulnerability and a composite risk index with 10 to 500 year scenarios.
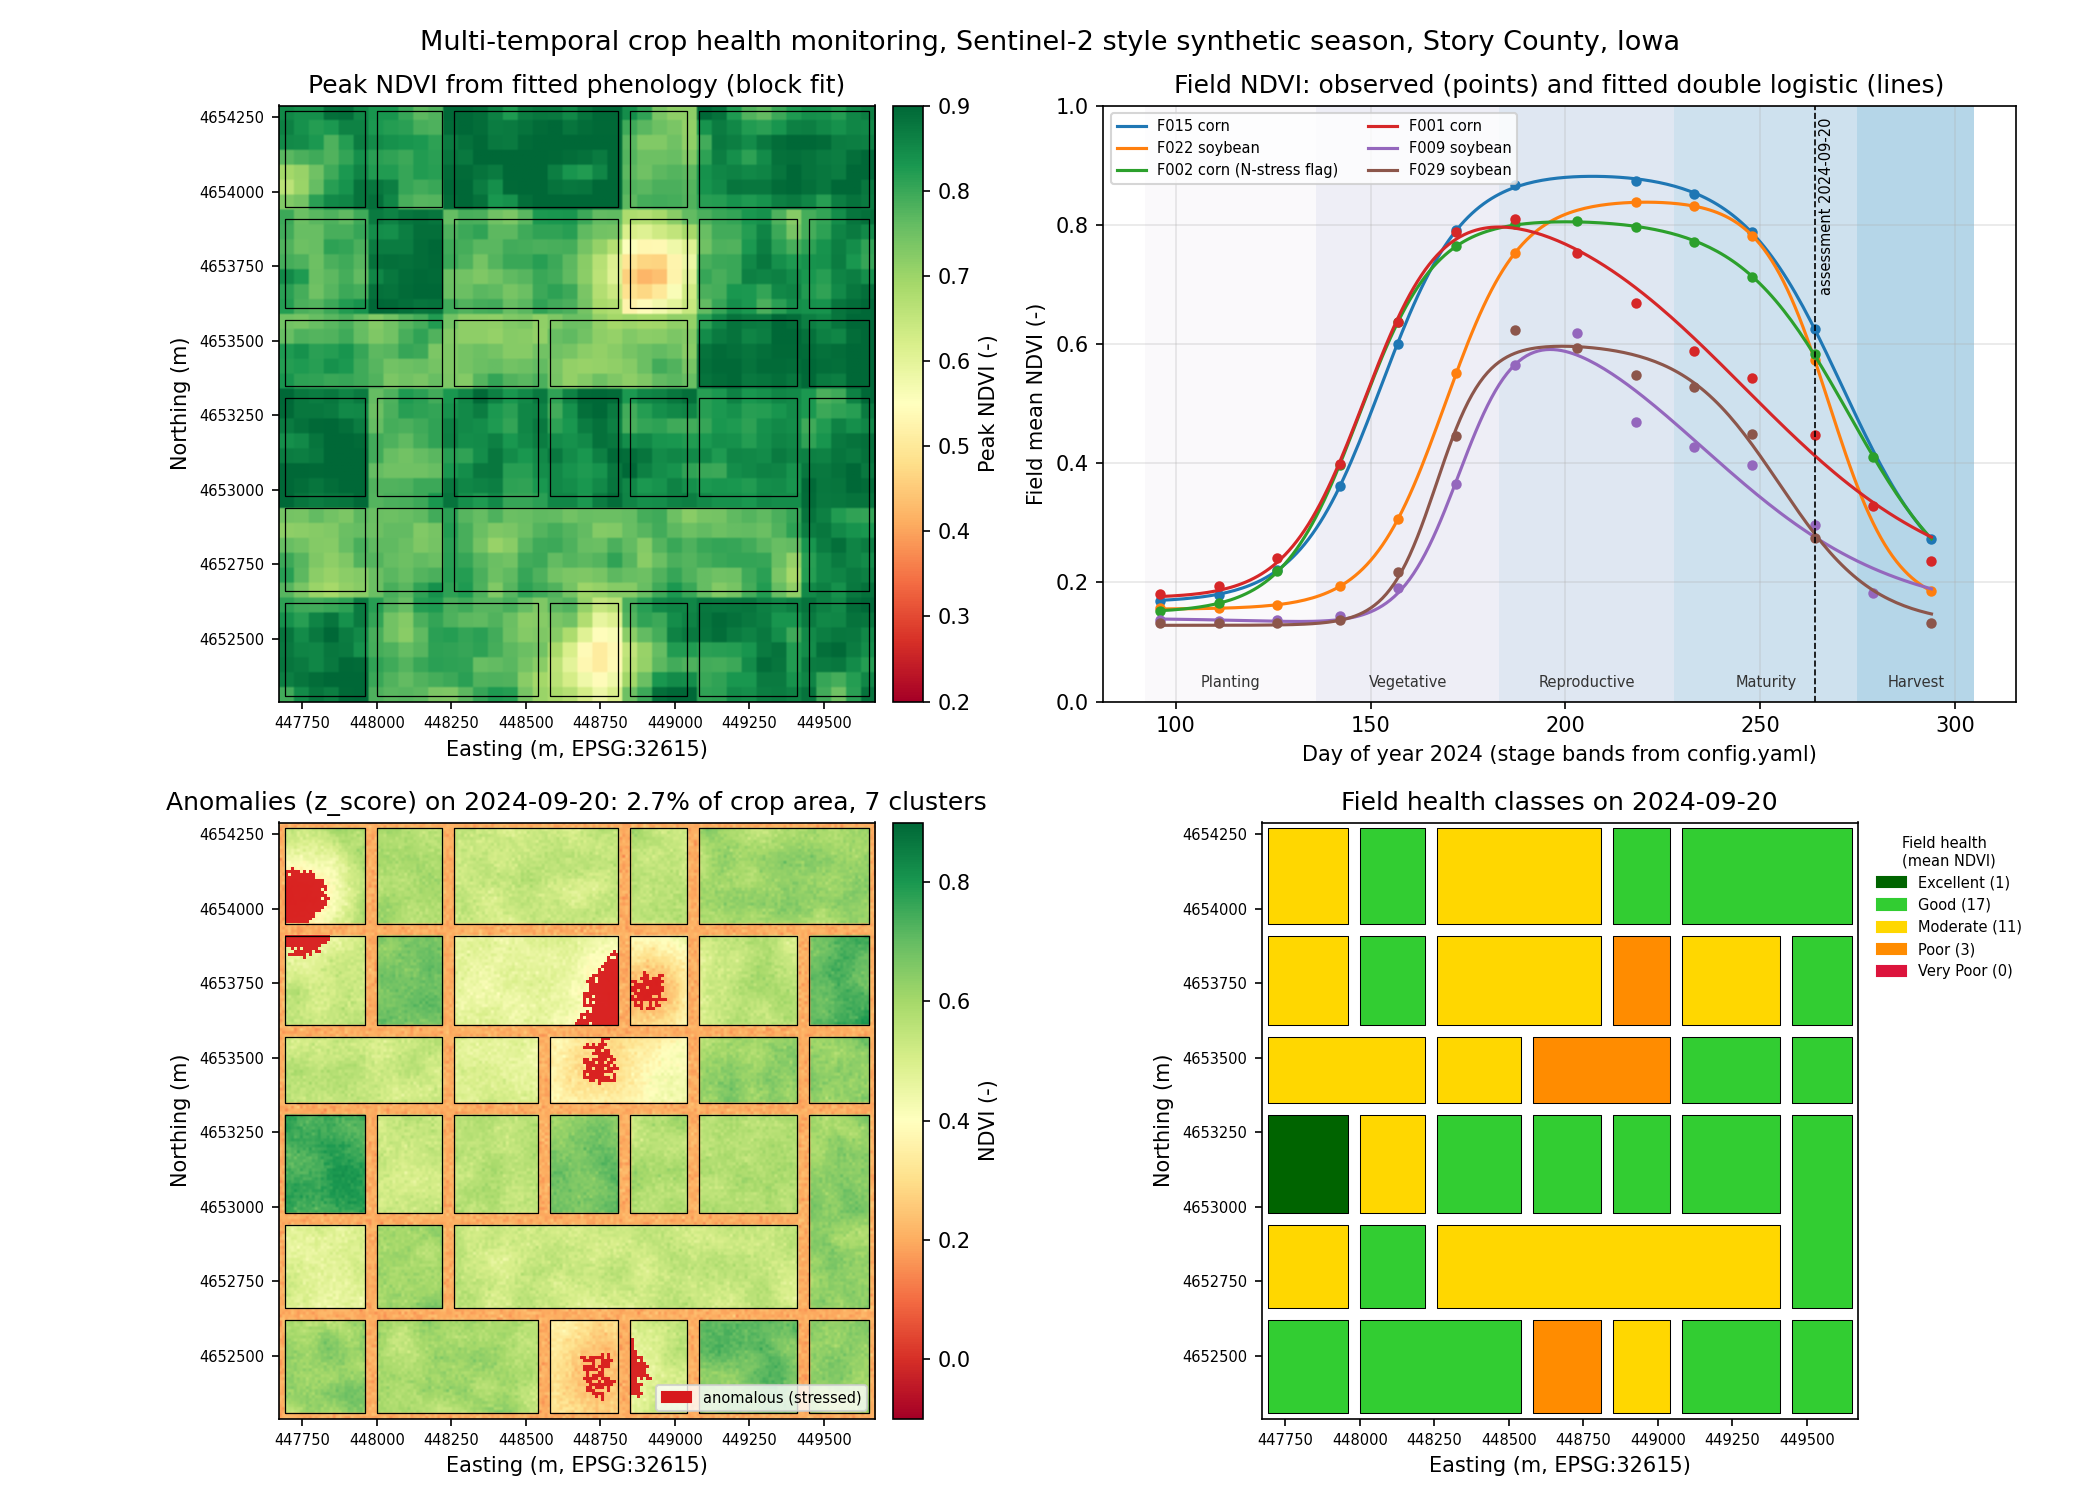
A full Sentinel-2 season: cloud masking, five vegetation indices, double-logistic phenology fitting, stress anomaly detection and per-field health reports for growers and agronomists.
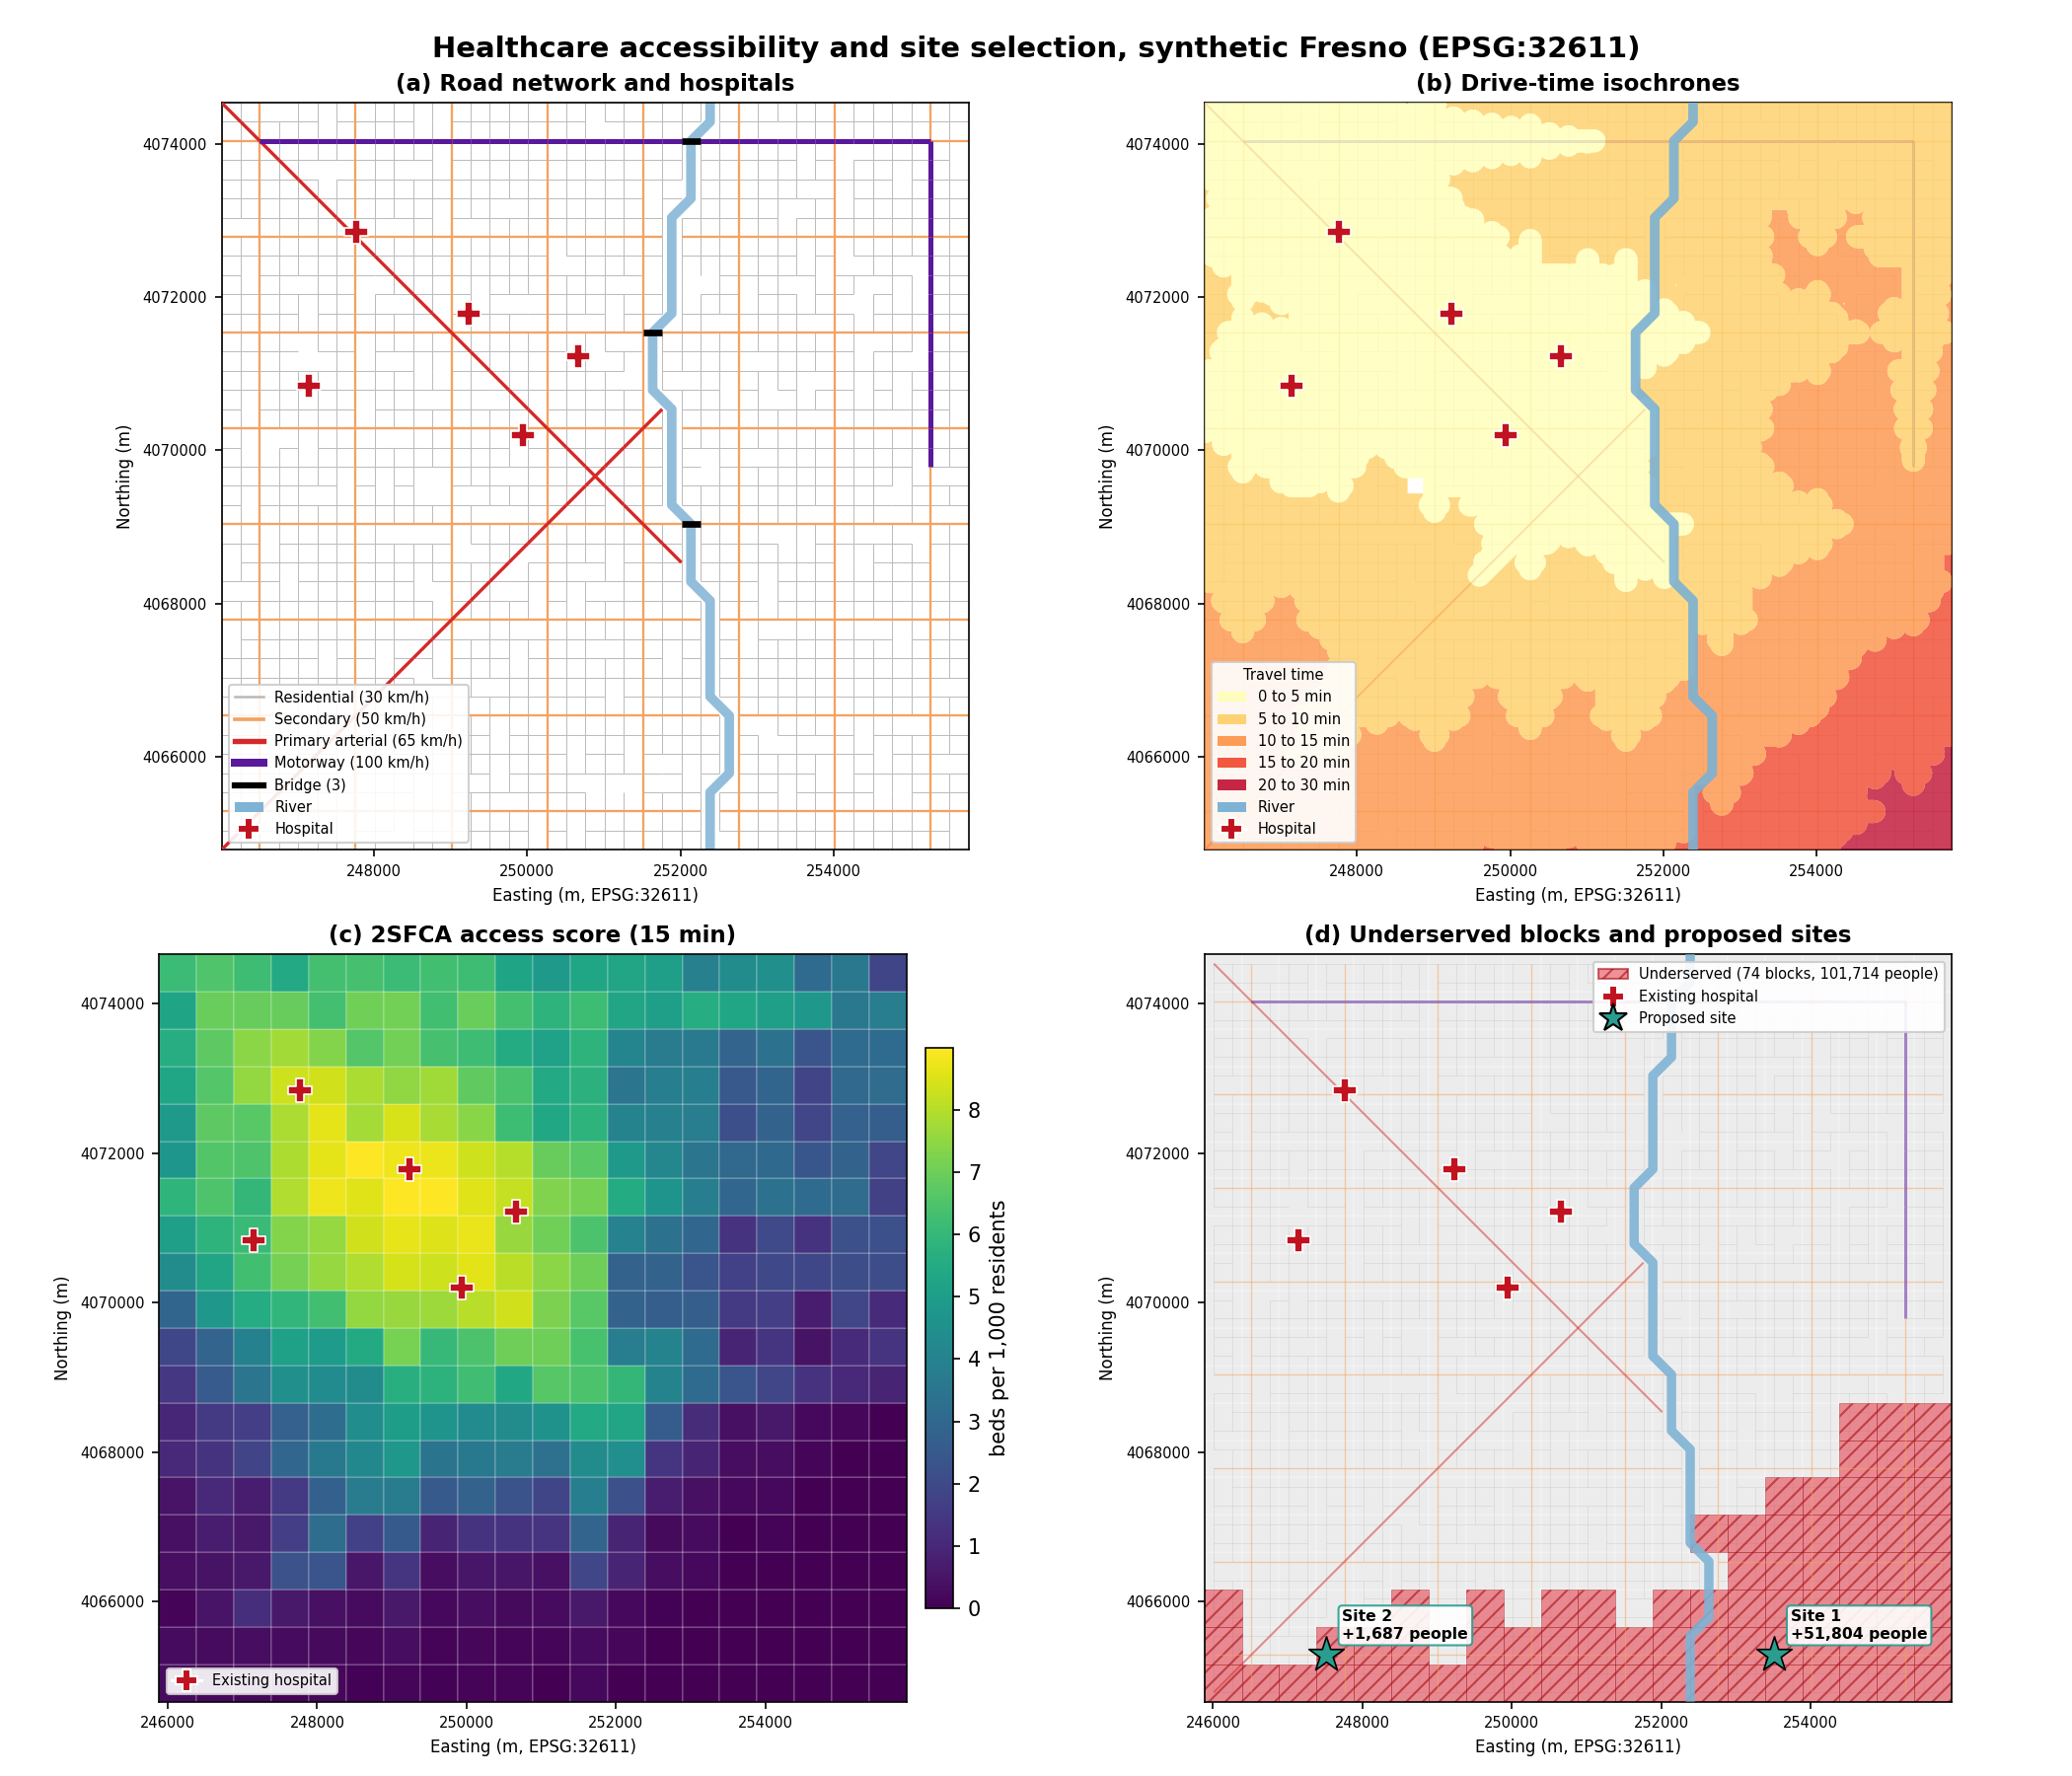
Road-network travel times, drive-time isochrones, two-step floating catchment accessibility scores, underserved block detection and a greedy maximal-coverage model for placing new facilities.
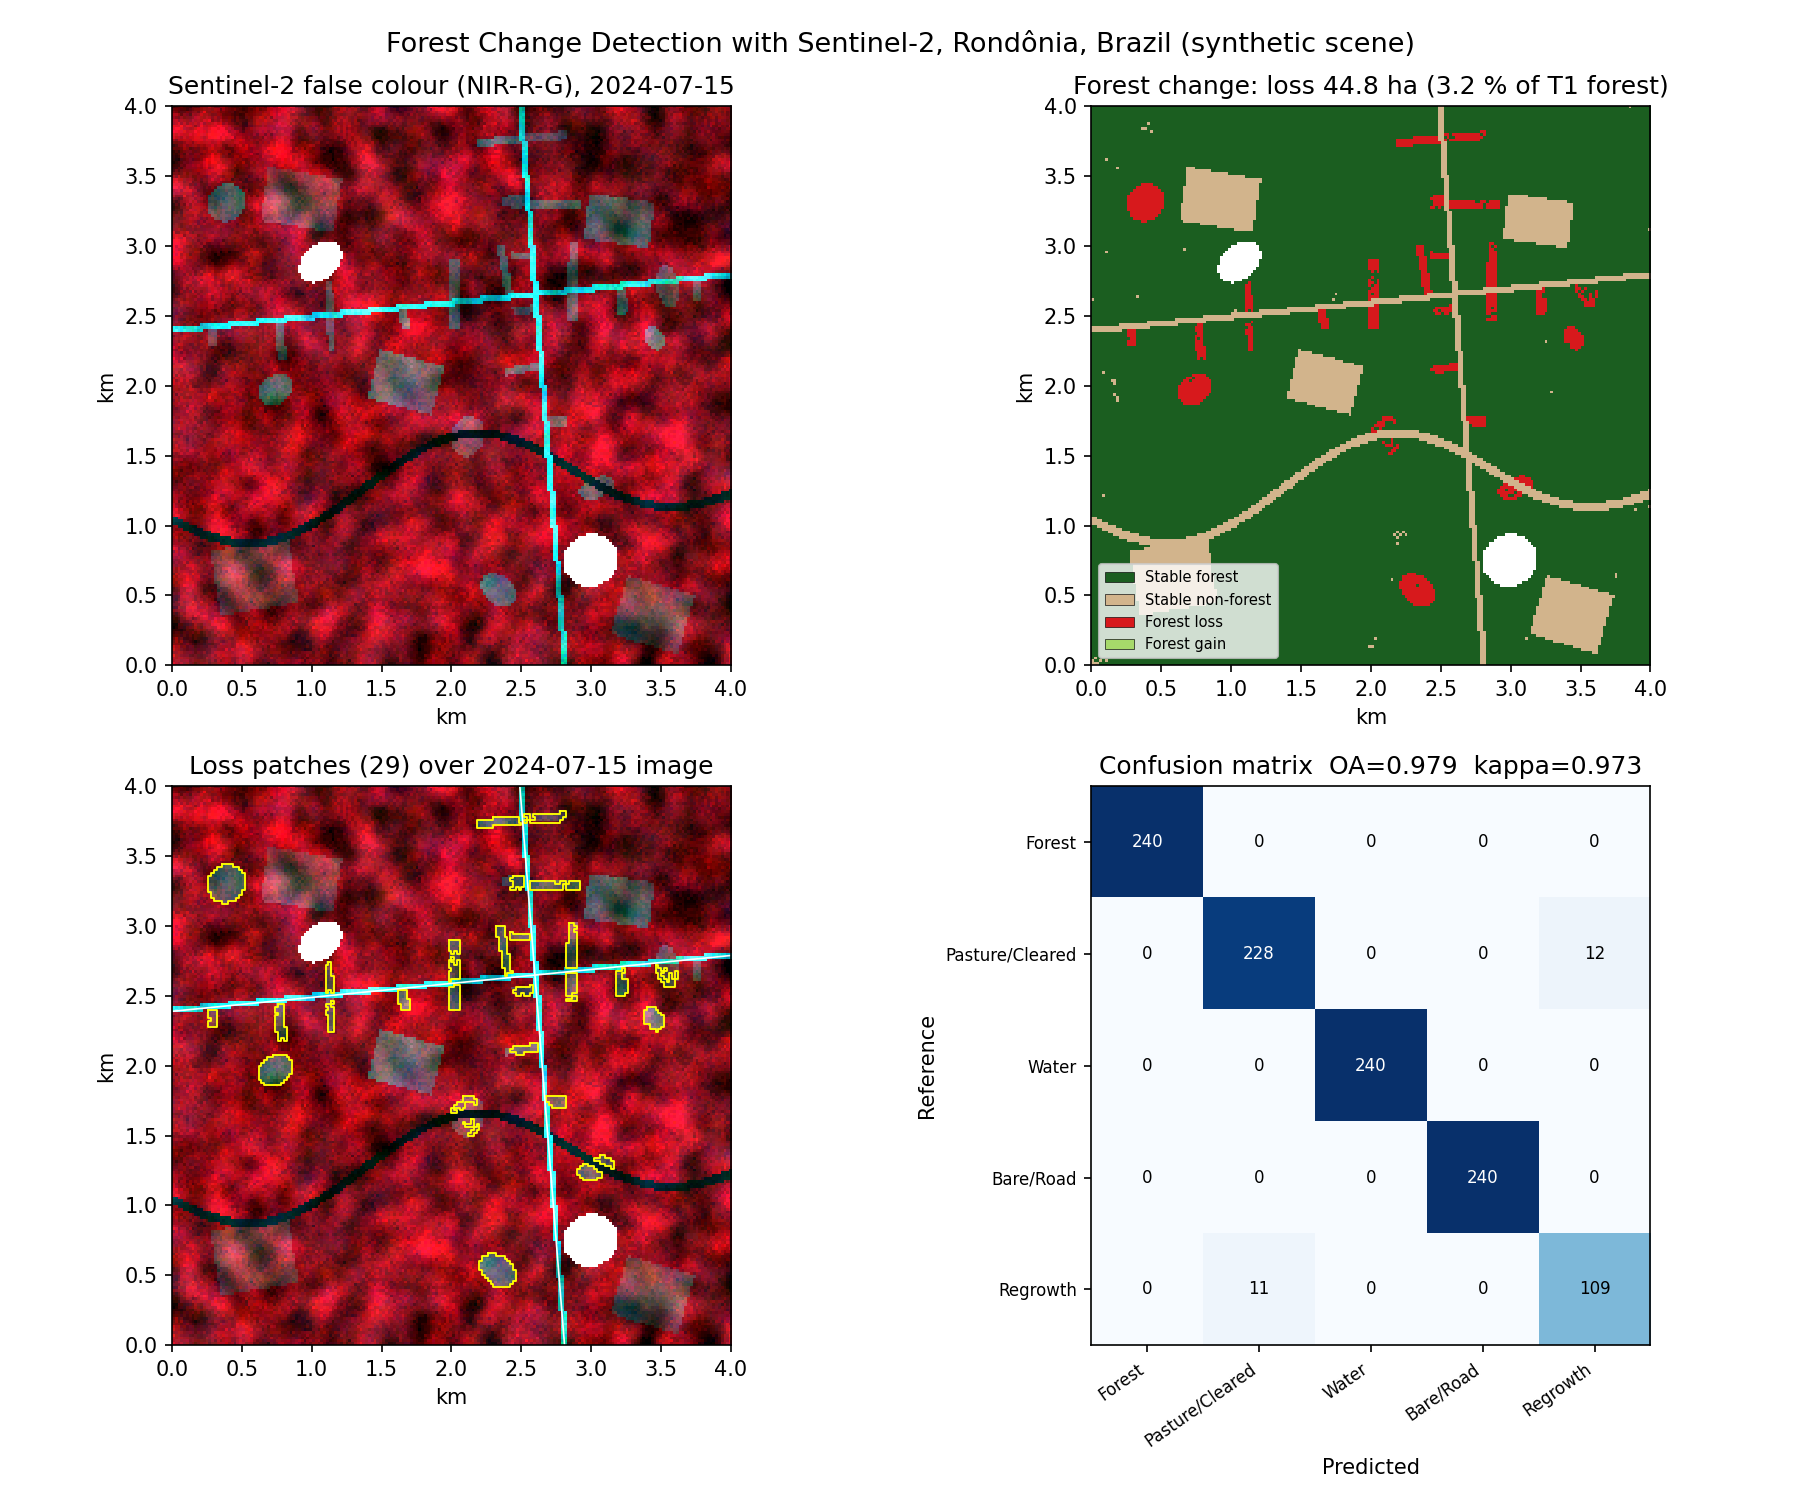
Two-date Sentinel-2 Random Forest classification, post-classification change combined with dNBR, minimum-mapping-unit filtering, loss polygons and a full accuracy assessment.
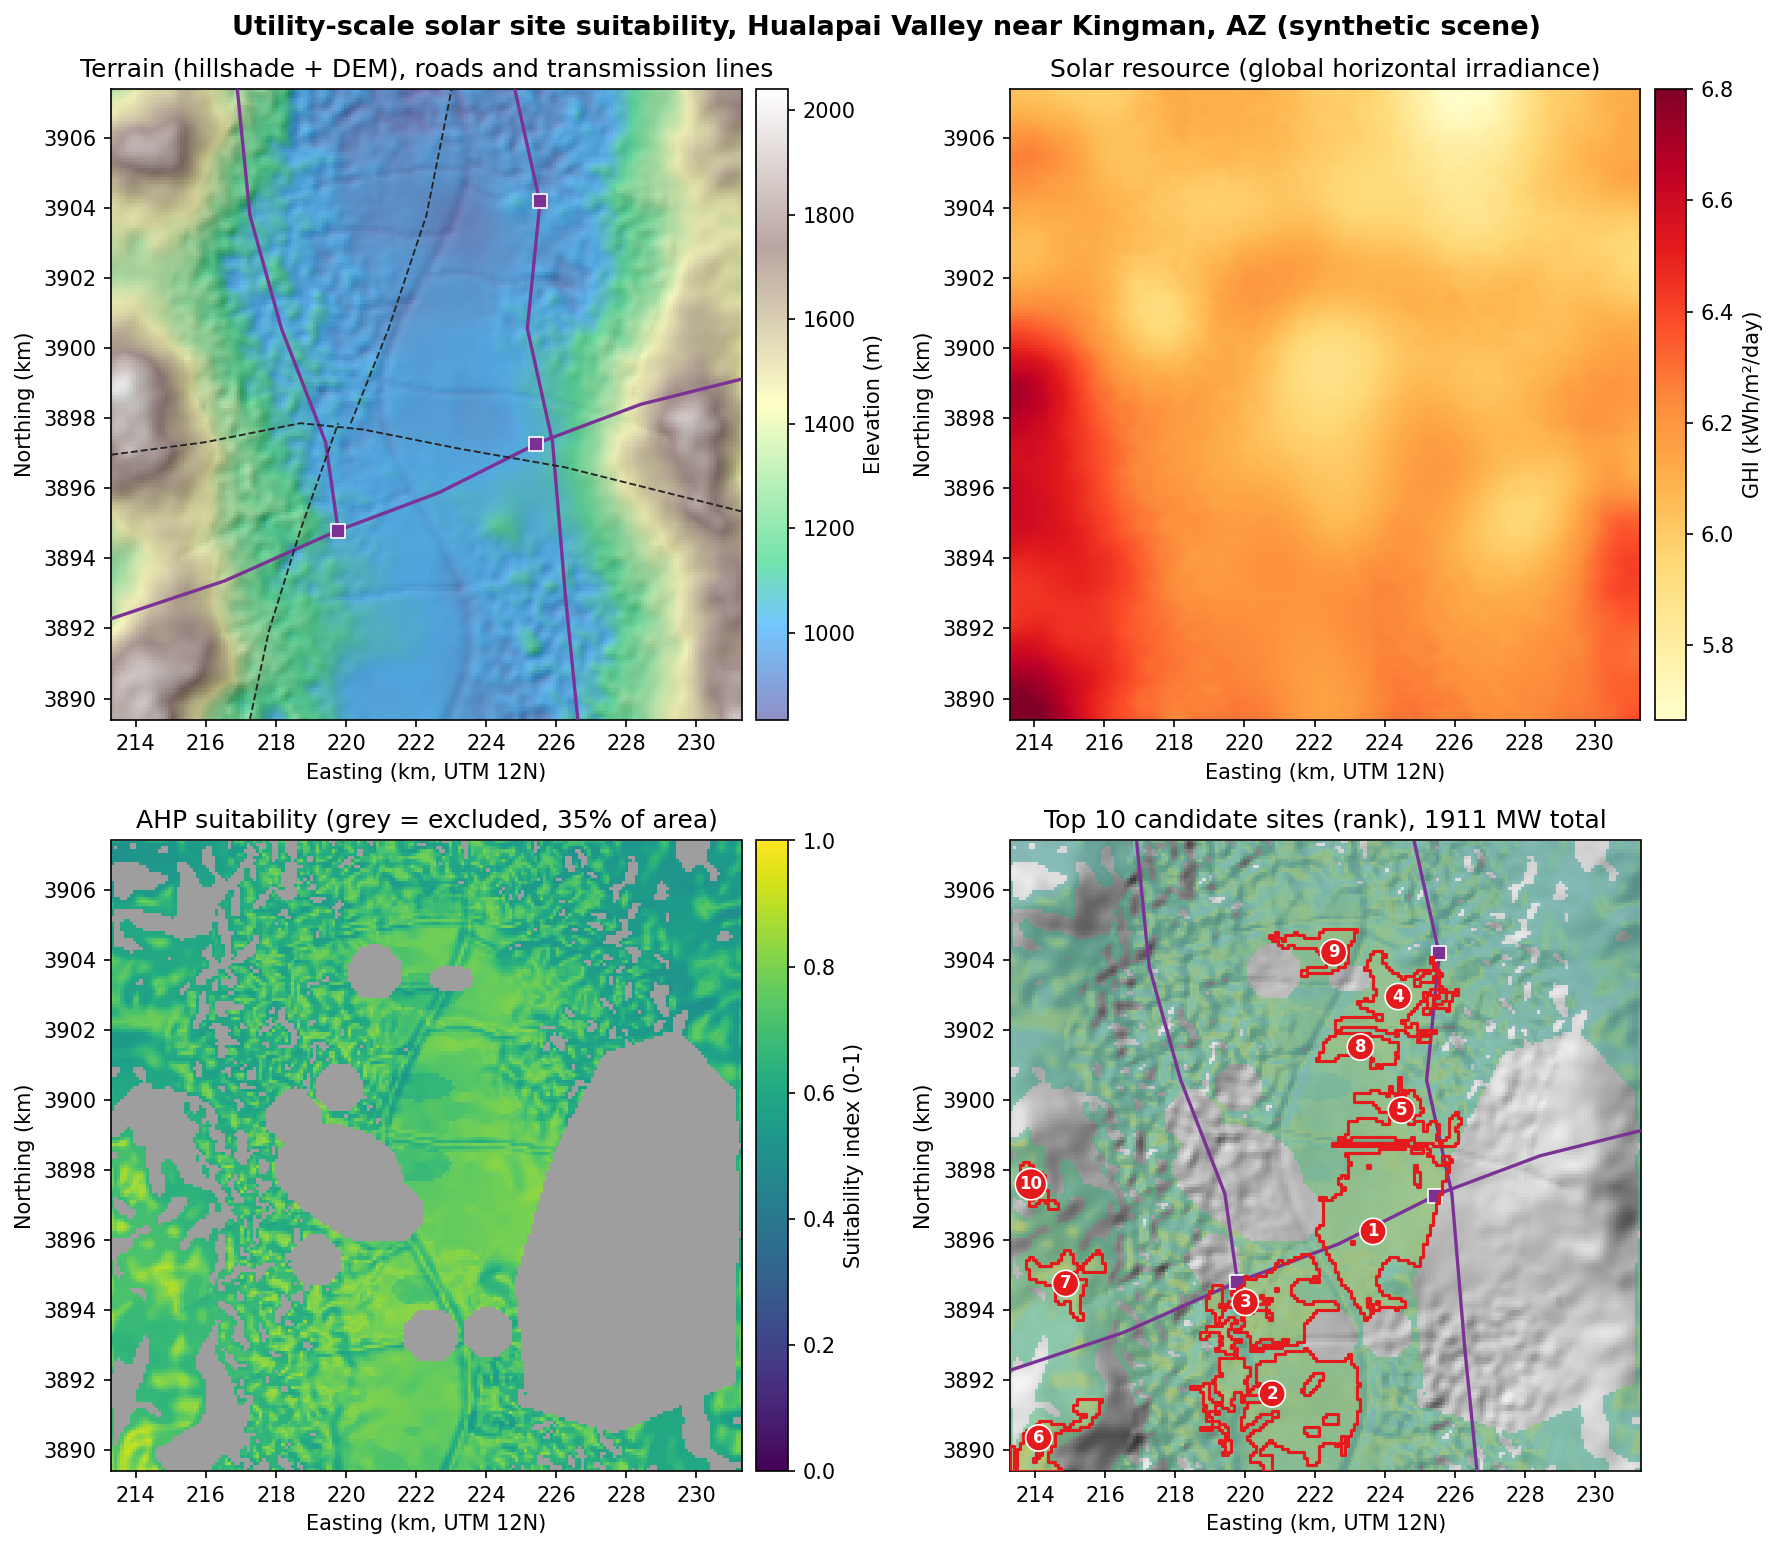
Terrain derivatives, standardized criterion curves, AHP weights, hard constraint masks and a weighted overlay that yields ranked candidate parcels with MW and GWh estimates.
No accounts, no downloads. Each demo builds a realistic georeferenced synthetic scene, runs the real pipeline code and writes rasters, vectors, figures and a web map.
git clone https://github.com/bhargavchintam/qgis-geospatial-projects.git cd qgis-geospatial-projects/flood-risk-assessment # or any other project pip install -r requirements.txt python demo.py # 2 to 10 seconds streamlit run app.py # interactive dashboard python -m pytest tests -q # tests
To use real data, point each project's config.yaml at your own rasters and vectors. Every README lists the public sources (USGS, Copernicus, NOAA, NLCD, Census, OpenStreetMap, NREL, HIFLD).
Grouped by what a GIS or geospatial data role usually asks for.
Land surface temperature, topographic wetness index, slope, aspect, hillshade, weighted overlays, zonal statistics, connected-component filtering.
Road graphs from lines, multi-source Dijkstra, isochrone polygons, 2SFCA accessibility, spatial joins, greedy facility location.
Landsat 8/9 Collection 2 thermal, Sentinel-2 L2A with SCL cloud masks, 10 m / 20 m resampling, NDVI, EVI, SAVI, NDRE, NDWI, NBR, phenology fitting.
Random Forest land cover, Isolation Forest and LOF anomalies, stratified sampling, confusion matrix, overall accuracy, kappa, producer's and user's accuracy.
AHP pairwise matrices, consistency ratio, sensitivity analysis, criterion standardization curves, constraint mapping.
Processing Toolbox algorithms (QgsProcessingAlgorithm), .qml symbology for rasters and vectors, PyQGIS, GDAL.
Config-driven pipelines, synthetic data generators, 158 pytest tests, GitHub Actions CI, Streamlit apps, Folium web maps, clean READMEs with reproducible numbers.